Graph Model
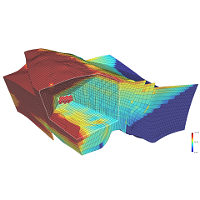
Interactive cutaways of oil reservoirs
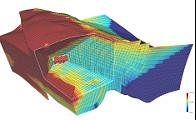
In the Oil and Gas industry, processing and visualizing 3D models is of paramount importance for making exploratory and production decisions. Hydrocarbons reservoirs are entities buried deep in the earth’s crust, and a simplified 3D geological model that mimics this environment is generated to run simulations and help understand geological and physical concepts. For the task of visually inspecting these models, we advocate the use of Cutaways: an illustrative technique to emphasize important structures or parts of the model by selectively discarding occluding parts, while keeping the contextual information. However, the complexity of reservoir models imposes severe restrictions and limitations when using generic illustrative techniques previously proposed by the computer graphics community. To overcome this challenge, we propose an interactive Cutaway method, strongly relying on screen-space GPU techniques, specially designed for inspecting 3D reservoir models represented as corner-point grids, the industry’s standard.
More Information
Gallery
Citation
BibTex
@article{bib:decarvalho:2016,
    author       = { de Carvalho, Felipe and Vital Brazil, Emilio and Marroquim, Ricardo and Souza, Mario and Oliveira, Antonio },
    title        = { Interactive cutaways of oil reservoirs },
    journal      = { Graph Model },
    volume       = { 84 },
    year         = { 2016 },
    pages        = { 1--14 },
    doi          = { 10.1016/j.gmod.2016.02.001 },
    dblp         = { journals/cvgip/CarvalhoBMSO16 },
    url          = { https://publications.graphics.tudelft.nl/papers/226 },
}