Nat Commun
Visual analysis of mass cytometry data by hierarchical stochastic neighbour embedding reveals rare cell types
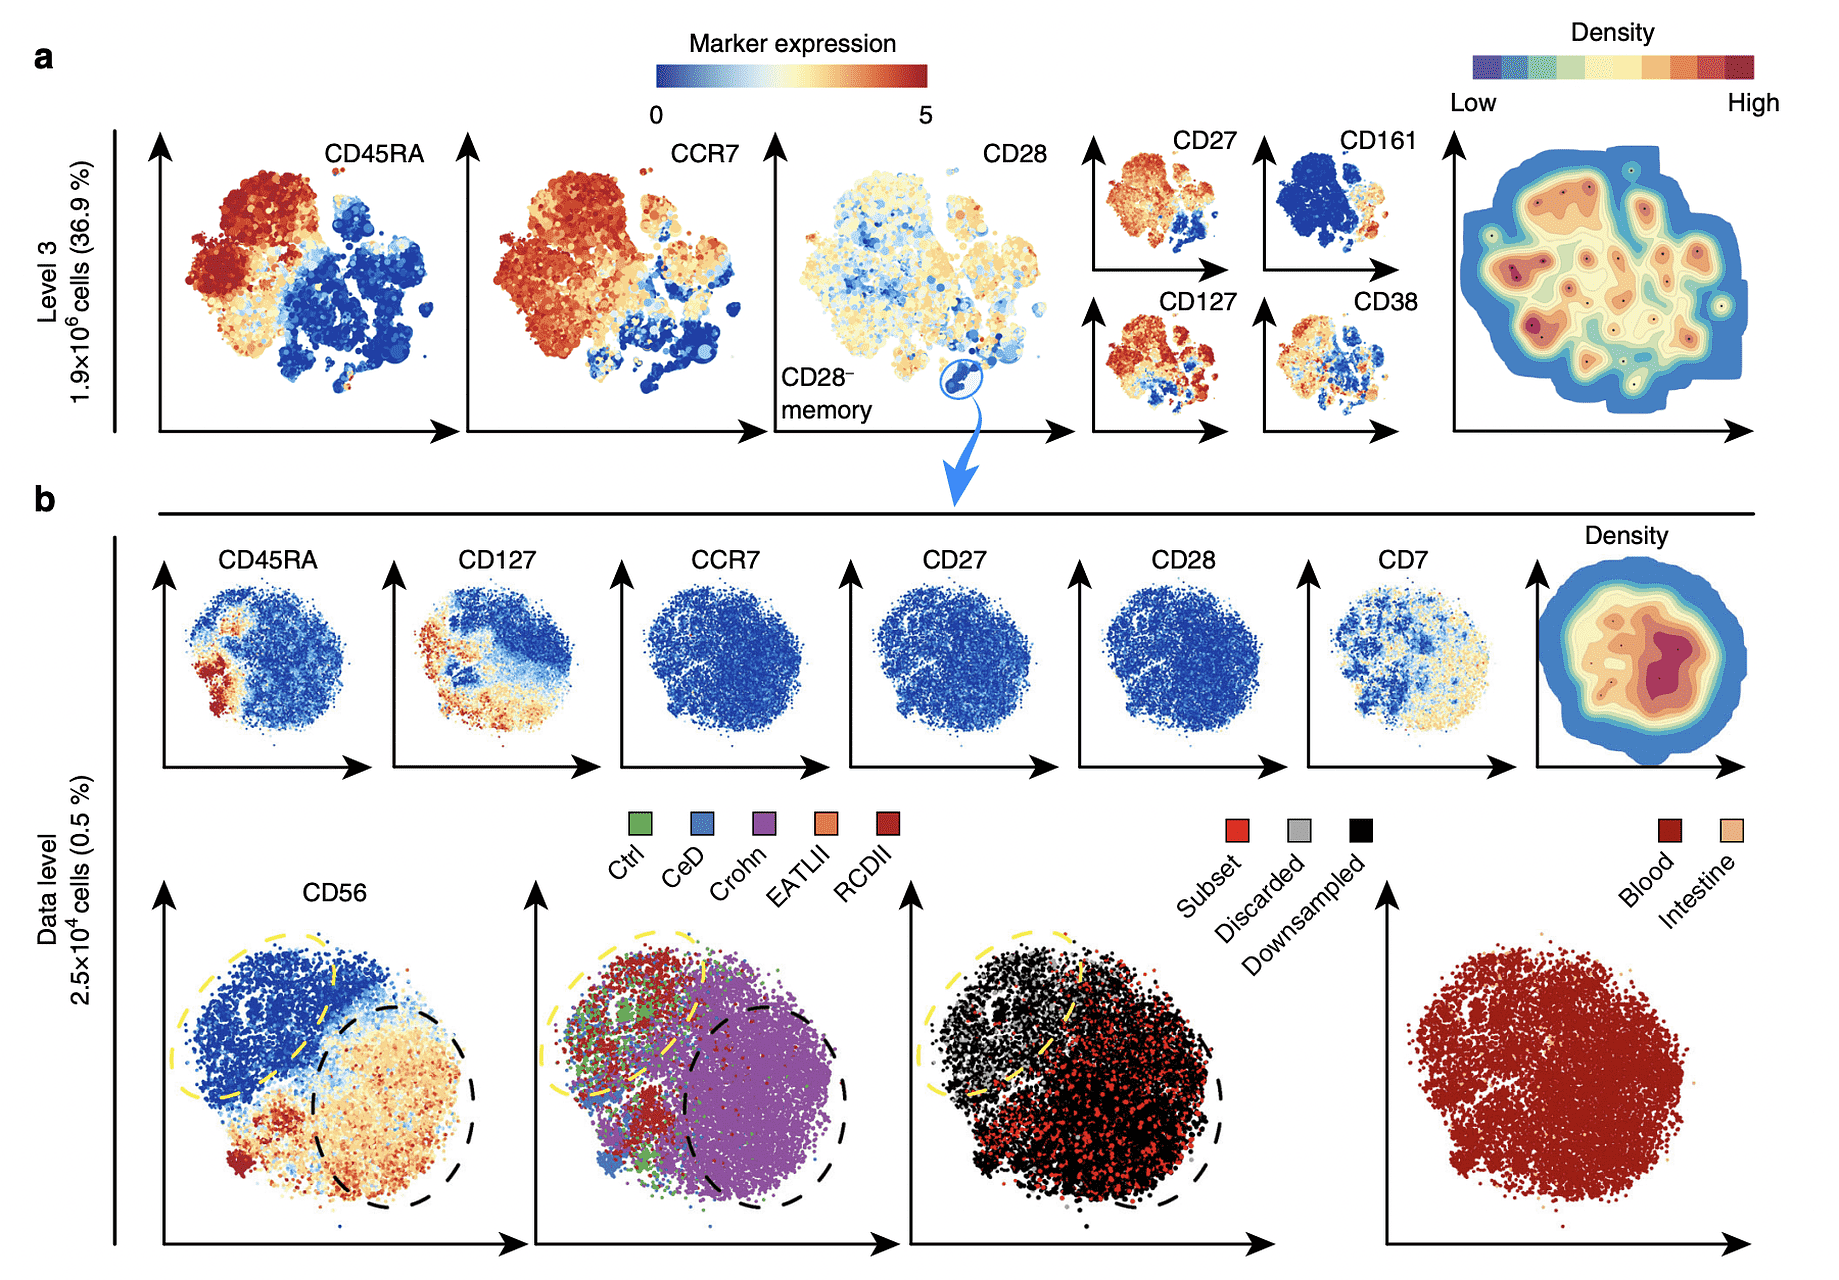
Mass cytometry allows high-resolution dissection of the cellular composition of the immune system. However, the high-dimensionality, large size, and non-linear structure of the data poses considerable challenges for the data analysis. In particular, dimensionality reduction-based techniques like t-SNE offer single-cell resolution but are limited in the number of cells that can be analyzed. Here we introduce Hierarchical Stochastic Neighbor Embedding (HSNE) for the analysis of mass cytometry data sets. HSNE constructs a hierarchy of non-linear similarities that can be interactively explored with a stepwise increase in detail up to the single-cell level. We apply HSNE to a study on gastrointestinal disorders and three other available mass cytometry data sets. We find that HSNE efficiently replicates previous observations and identifies rare cell populations that were previously missed due to downsampling. Thus, HSNE removes the scalability limit of conventional t-SNE analysis, a feature that makes it highly suitable for the analysis of massive high-dimensional data sets.
More Information
Gallery

Citation
BibTex
@article{bib:vanunen:2017,
    author       = { van Unen, Vincent and Höllt, Thomas and Pezzotti, Nicola and Li, Na and Reinders, Marcel and Eisemann, Elmar and Vilanova, Anna and Koning, Frits and Lelieveldt, Boudewijn P. F. },
    title        = { Visual analysis of mass cytometry data by hierarchical stochastic neighbour embedding reveals rare cell types },
    journal      = { Nat Commun },
    volume       = { 8 },
    year         = { 2017 },
    pages        = { 1740 },
    doi          = { 10.1038/s41467-017-01689-9 },
    pubmedid     = { 29170529 },
    url          = { https://publications.graphics.tudelft.nl/papers/251 },
}