2012

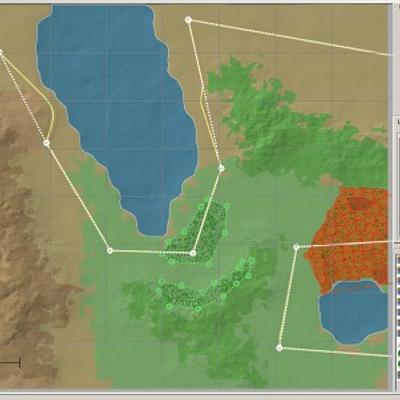
Extended Serious Games Multidimensional Interoperability Framework (SG-MIF)
Ioana Stanescu, Antoniu Stefan, Milos Kravcik, Theo Lim, and Rafael Bidarra
In Proceedings of eLSE 2012 - 8th International Conference on eLearning and Software for Education, 2012
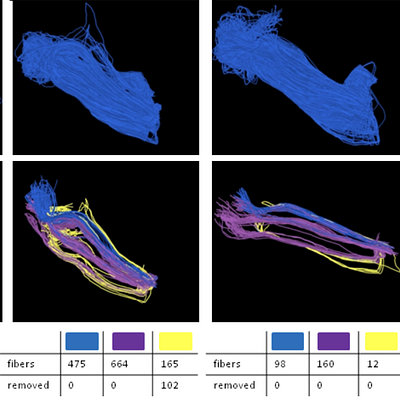
Result of fiber tracking using three seedpoints based on the activity maps
C. Tax, R. Duits, B.M. ter Haar Romeny, and Anna Vilanova
In Proceedings of International Conference on Information and Automation, 2012
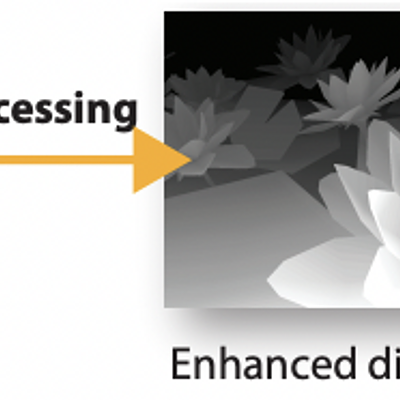
From left to right: Starting from an original depth map a pixel disparity map is computed and then a disparity pyramid is built. After multi-resolution disparity processing, the dynamic range of disparity is adjusted and the resulting enhanced disparity map is produced. The map is then used to create enhanced stereo image.
Piotr Didyk, Tobias Ritschel, Elmar Eisemann, Karol Myszkowski, and Hans-Peter Seidel
In Proceedings of Human Vision and Electronic Imaging, 2012
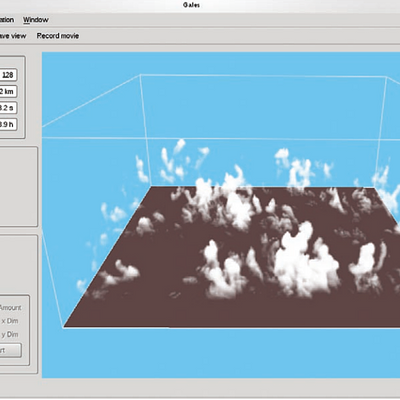
A screenshot of an interactive simulation with GALES. The 3D cloud field visualization is shown using volume rendering. During the simulation, the visualization can be actively zoomed and rotated to directly obtain insight into the simulation process.
Jerome Schalkwijk, Eric Griffith, Frits H. Post, and H.J.J. Jonker
Bulletin of the American Meteorological Society (BAMS), 2012
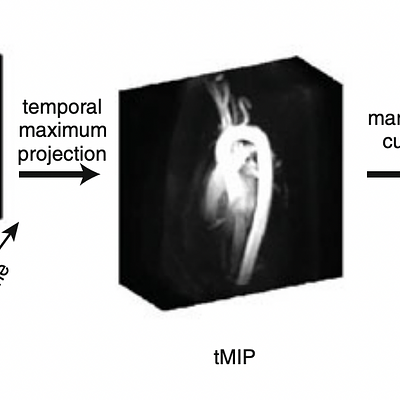
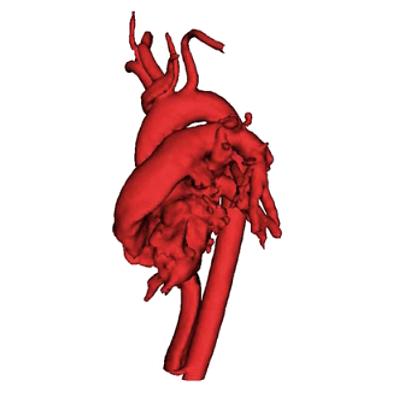
A temporal maximum speed volume (tMSV) takes the maximum blood-flow speed for each voxel throughout the cardiac cycle. An initial surface can be extracted from this static representation of the blood-flow regions. A standard marching cubes algorithm is employed to generate the iso-surface
R.F.P. van Pelt, Thuc Nghi Nguyen, B.M. ter Haar Romeny, and Anna Vilanova
International Journal of Computer Assisted Radiology and Surgery, 2012
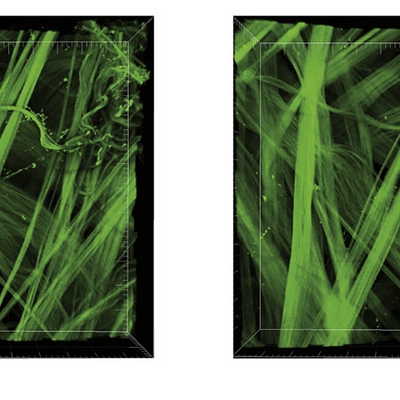
Collagen fibers in the adventitia of the carotid artery (sample 1). The same area was imaged at different pressure steps from 0 to 140 mm Hg; eight intermediate steps are shown. The gradual straightening of (individual) fibers is observed. The biggest configuration change mainly occurs between 40 and 80 mm Hg.
J.T.C. Schrauwen, Anna Vilanova, R. Rezakhaniha, N. Stergiopulos, F.N. van de Vosse, and P.H.M. Bovendeerd
Journal of Structural Biology, 2012
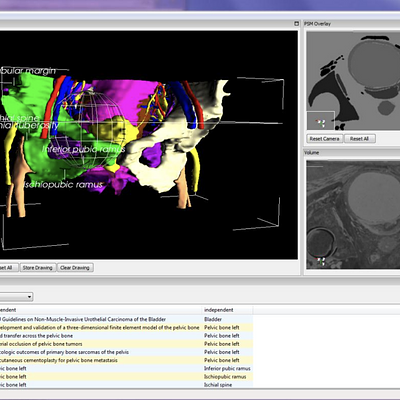
A distance query returns all information related to the structures inside the sphere.
Noeska Natasja Smit, Anne C. Kraima, Daniel Jansma, Marco C. Deruiter, and Charl P. Botha
In Proceedings of 3D Physiological Human Workshop, 2012
Example of hybrid visualization of CSD [6] and 2nd order ODFs
V. Prckovska, M. Descoteaux, C. Poupon, B.M. ter Haar Romeny, and Anna Vilanova
New developments in the visualization and processing of tensor fields, 2012
R.F.P. van Pelt, H. Nguyen, B.M. ter Haar Romeny, and Anna Vilanova
International Journal of Computer Assisted Radiology and Surgery, 2012
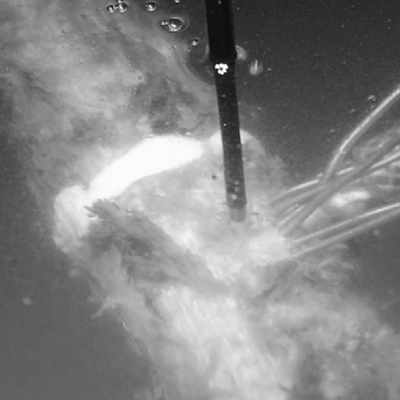
Example of a femur equipped with thermocouples, a close up of the measurement location.
Gert Kraaij, Daniel F. Malan, Huub J. L. van der Heide, Jenny Dankelman, Rob. G. H. H. Nelissen, and Edward R. Valstar
Med Eng Phys, 2012
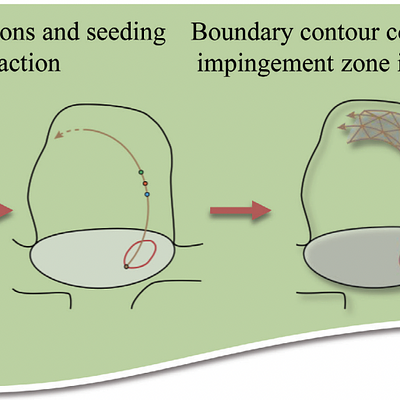
Overview of the extraction approach: Based on the flow grid and the aneurysm ostium we seed streamlines at the ostium into the aneurysm. We identify several local line properties on the streamlines to compute a quality scalar field on the ostium. Given this scalar field we extract a seeding curve on the ostium, which is used to construct the boundary contour of the inflow jet. A second scalar field is computed on the aneurysm surface to indicate the impingement zone. Finally, we visualize both information expressively.
R. Gasteiger, D. Lehmann, R.F.P. van Pelt, G. Janiga, O. Beuing, et al.
IEEE Transactions on Visualization and Computer Graphics, 2012
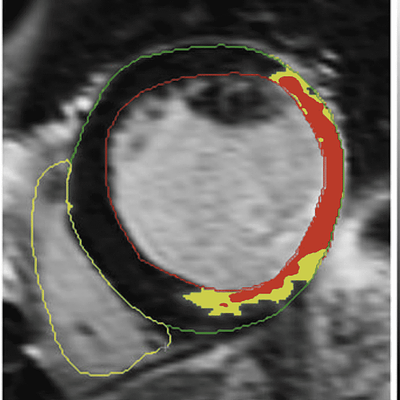
The preprocessing steps. Left Definition of the contours, Middle Definition of scar (gray zone (in yellow) and core zone (in red)) and Right The composition of the mesh based on the contours in 3D. The last described preprocessing step of indicating the position of the origin of the left main coronary artery is not included in this figure
Corine Godeschalk-Slagboom, Rob van der Geest, Katja Zeppenfeld, and Charl P. Botha
International Journal of Computer Assisted Radiology and Surgery, 2012
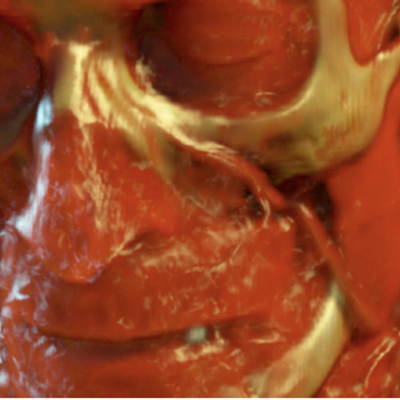
Orthopaedic workflow for hip prosthesis replacement: A 3D CT-scan (a) is segmented into labels (b). This discrete volume image is converted to a volume mesh (c). Based on medical simulations (d) [1], optimal implant design and positioning can be determined.
Christian Kehl, Daniel F. Malan, and Elmar Eisemann
In Proceedings of 3D NordOst Workshop, 2012
Lionel Baboud and Elmar Eisemann
In Proceedings of Intel Developers Forum, 2012
From left to right: rendering of the publicly available bonsai data set, which demonstrates that our method is able to render very thin participating media, Manix and Backpack data set. The examples illustrate how volumetric and surface scattering can be effectively combined in a single volume rendering
Thomas Kroes, Frits H. Post, and Charl P. Botha
PLoS One, 2012
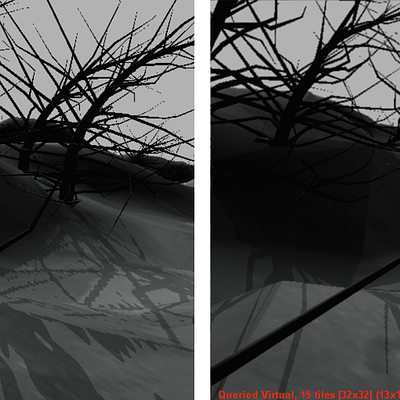
Standard 4,0962 shadow map with perspective warping, rendering at 64 FPS (left). QVSM with a maximum refinement level of 32 × 32 and 1,0242 tiles, rendering at 32 FPS (right). Adaptive subdivision effectively removes aliasing in cases that are difficult for reparametrization and global partitioning methods.
Elmar Eisemann, Ulf Assarsson, Michael Schwarz, Michal Valient, and Michael Wimmer
In Proceedings of SIGGRAPH Courses, 2012
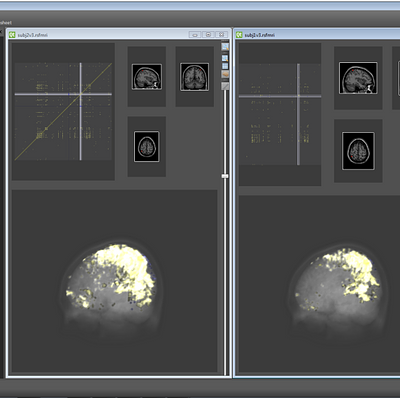
An overview of the application window with two datasets. Each dataset is opened in its own child window. Each child window contains of three views: the pixmap view on the top-left, the slice views on the top right and the anatomical view on the bottom.
Andre F. van Dixhoorn, Julien Milles, Baldur van Lew, and Charl P. Botha
In Proceedings of Visual Computing in Biology and Medicine, 2012
 Example of a transformation into a multi-component target
Marcelo Renhe, Antonio Oliveira, Claudio Esperança, and Ricardo Marroquim
In Proceedings of SIBGRAPI, 2012

2011

Ruben M. Smelik, Tim Tutenel, Klaas Jan de Kraker, and Rafael Bidarra
Computers & Graphics, 2011