2019
Computer Graphics Forum,
2019
In Proceedings of Eurographics (Dirk Bartz Prize),
2019
In Proceedings of FDG,
2019
Computer Graphics Forum,
2019
In Proceedings of High Performance Graphics (Short Papers),
2019
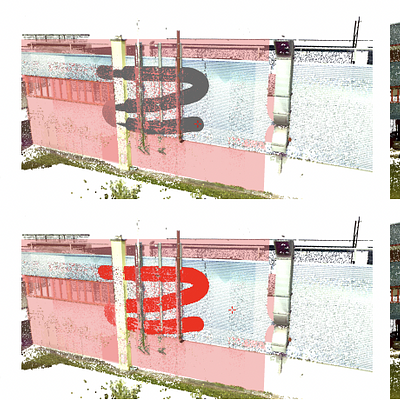
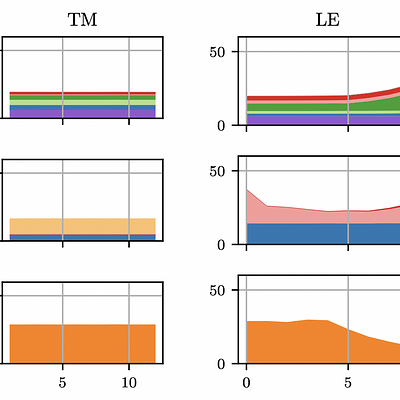
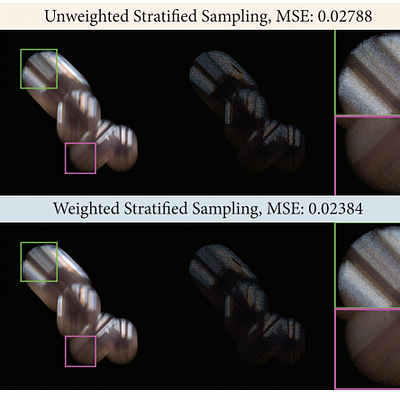
![: Comparison between gradient-domain reconstruction and Monte Carlo denoising. For surface rendering, gradient-domain rendering is less efficient than Monte Carlo denoisers that use auxiliary buffers (NFOR [BRM∗ 16]) or histograms of path samples (BCD [BB17]). NFOR could also be applied to address noisy regions remaining in gradient-domain path tracing by using the reconstructed image as guiding features, leading to improved image quality (see G-PT + NFOR in the KITCHEN scene). For volume rendering, gradient-domain rendering is comparable to Monte Carlo denoisers, particularly with photon density estimation.](https://publications.graphics.tudelft.nl/rails/active_storage/representations/redirect/eyJfcmFpbHMiOnsibWVzc2FnZSI6IkJBaHBBc3NEIiwiZXhwIjpudWxsLCJwdXIiOiJibG9iX2lkIn19--4731723aa54c9a4f64c86fbded9e080fcce0ffed/eyJfcmFpbHMiOnsibWVzc2FnZSI6IkJBaDdCem9MWm05eWJXRjBTU0lJY0c1bkJqb0dSVlE2RTNKbGMybDZaVjkwYjE5bWFXeHNXd2RwQXBBQmFRS1FBUT09IiwiZXhwIjpudWxsLCJwdXIiOiJ2YXJpYXRpb24ifX0=--8786188a9503cffd21c59bbcd5519930c73c621f/hua-survey.png)

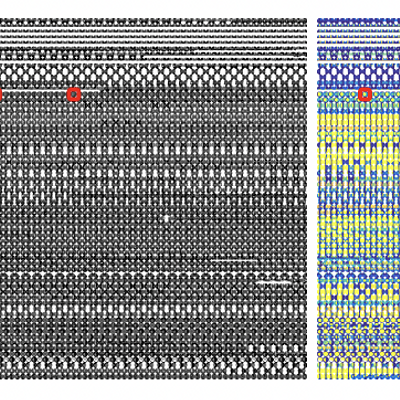
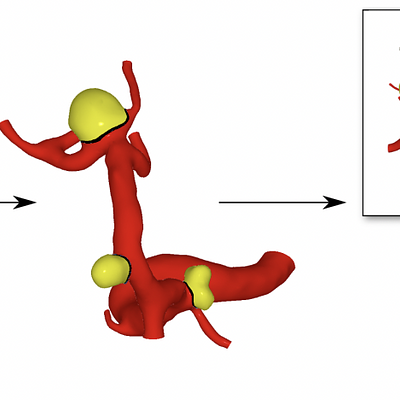
![Left: Input shapes X1 and X2 (taken from [PRMB15]) and reconstruction of linear average (Z(X1) +Z(X2))/2 ∈ M/ with the local violations of the integrability condition as color map. Rightmost shapes: reconstruction using various spanning trees color coded with respect to the order of traversal.](https://publications.graphics.tudelft.nl/rails/active_storage/representations/redirect/eyJfcmFpbHMiOnsibWVzc2FnZSI6IkJBaHBBdUVEIiwiZXhwIjpudWxsLCJwdXIiOiJibG9iX2lkIn19--75494a93bf61a093addd8f784a97feeb5b83d5b7/eyJfcmFpbHMiOnsibWVzc2FnZSI6IkJBaDdCem9MWm05eWJXRjBTU0lJY0c1bkJqb0dSVlE2RTNKbGMybDZaVjkwYjE5bWFXeHNXd2RwQXBBQmFRS1FBUT09IiwiZXhwIjpudWxsLCJwdXIiOiJ2YXJpYXRpb24ifX0=--8786188a9503cffd21c59bbcd5519930c73c621f/nric-teaser.png)
In Proceedings of Visual Computing in Biology and Medicine,
2019
In Proceedings of GALA,
2019
In Proceedings of GALA,
2019