2021

Journal of Vision,
2021

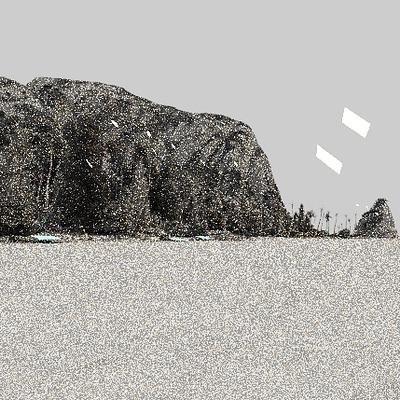
PFG – Journal of Photogrammetry, Remote Sensing and Geoinformation Science,
2021
In Proceedings of AUTOMATA2021,
2021
2020
In Proceedings of GALA,
2020

ACM Comput Graph Interact Tech,
2020
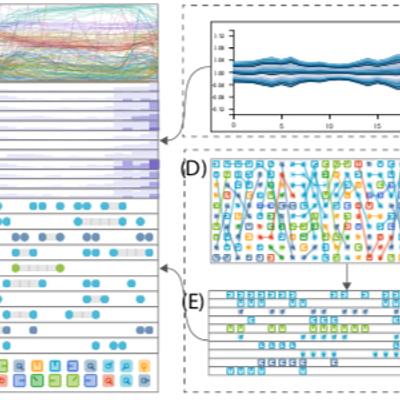
In Proceedings of PacificVis,
2020
In Proceedings of Eurographics (Short Papers),
2020
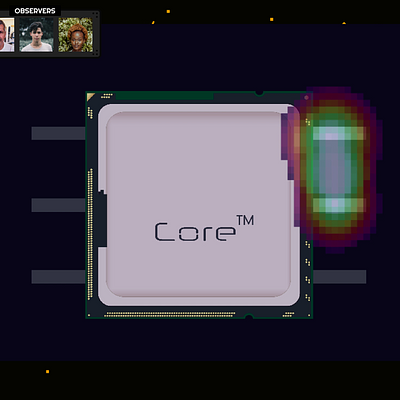
In Proceedings of CHI PLAY (Companion),
2020

In Proceedings of FDG,
2020


IEEE Transactions on Visualization and Computer Graphics,
2020
In Proceedings of IEEE Conference on Games,
2020

Comput Aided Geom Des,
2020