2013

Int J Biomed Imaging,
2013
In Proceedings of GALA,
2013
2012
In Proceedings of Eurographics (Tutorials),
2012
In Proceedings of Vision, Modeling, and Visualization,
2012
Journal of Structural Biology,
2012
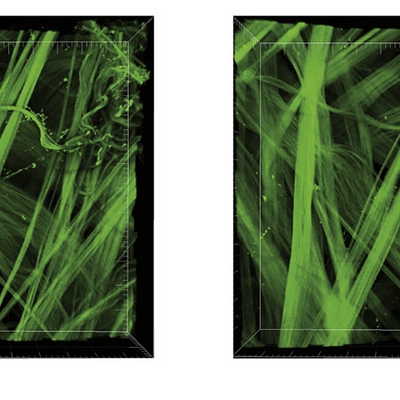
![Example of hybrid visualization of CSD [6] and 2nd order ODFs](https://publications.graphics.tudelft.nl/rails/active_storage/representations/redirect/eyJfcmFpbHMiOnsibWVzc2FnZSI6IkJBaHBBbWtLIiwiZXhwIjpudWxsLCJwdXIiOiJibG9iX2lkIn19--2b2da5943c23ac993c4db3822b5ff93e4ef706c8/eyJfcmFpbHMiOnsibWVzc2FnZSI6IkJBaDdCem9MWm05eWJXRjBTU0lJY0c1bkJqb0dSVlE2RTNKbGMybDZaVjkwYjE5bWFXeHNXd2RwQXBBQmFRS1FBUT09IiwiZXhwIjpudWxsLCJwdXIiOiJ2YXJpYXRpb24ifX0=--8786188a9503cffd21c59bbcd5519930c73c621f/Example%20of%20hybrid%20visualization.png)
New developments in the visualization and processing of tensor fields,
2012
Comput Animat Virtual Worlds,
2012
%20.png)
In Proceedings of eLSE 2012 - 8th International Conference on eLearning and Software for Education,
2012
ACM Transactions on Graphics,
2012
SIAM J Imaging Sci,
2012
In Proceedings of EuroVis (Short Papers),
2012
IEEE Transactions on Visualization and Computer Graphics,
2012
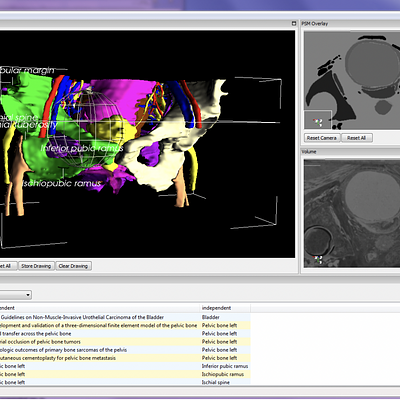
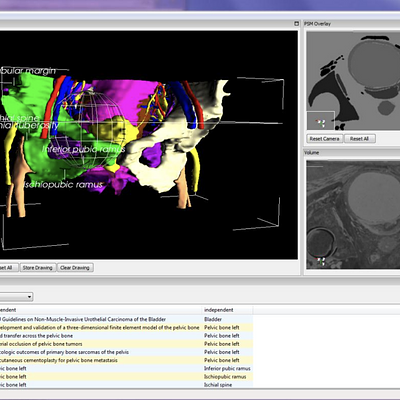
International Journal of Computer Assisted Radiology and Surgery,
2012
In Proceedings of AAAI Workshop on Human Computation in Digital Entertainment and Artificial Intelligence for Serious Games, co-located with AIIDE 2012 - 8th Conference on Artificial Intelligence and Interactive Digital Entertainment,
2012
In Proceedings of 3D Physiological Human Workshop,
2012
In Proceedings of Human Vision and Electronic Imaging,
2012