2012

In Proceedings of International Conference on Information and Automation,
2012

Skeletal Radiol,
2012
Lecture Notes in Geoinformation and Cartography,
2012
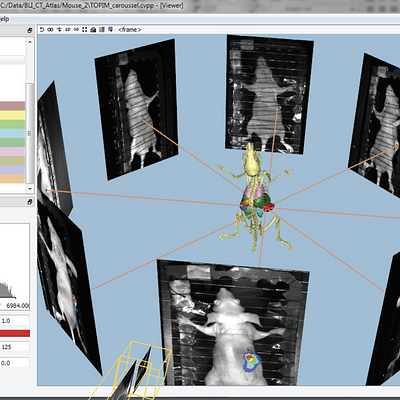
In Proceedings of TOPIM - Hot Topics in Molecular Imaging,
2012

SIAM J Imaging Sci,
2012
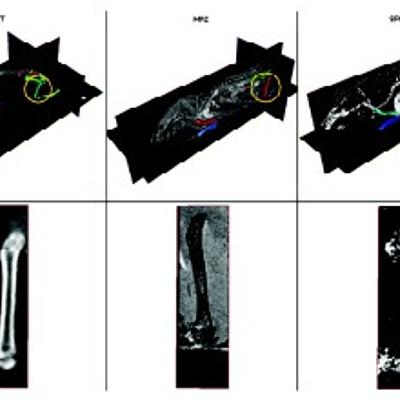
![Orthopaedic workflow for hip prosthesis replacement: A 3D CT-scan (a) is segmented into labels (b). This discrete volume image is converted to a volume mesh (c). Based on medical simulations (d) [1], optimal implant design and positioning can be determined.](https://publications.graphics.tudelft.nl/rails/active_storage/representations/redirect/eyJfcmFpbHMiOnsibWVzc2FnZSI6IkJBaHBBbThLIiwiZXhwIjpudWxsLCJwdXIiOiJibG9iX2lkIn19--8f7c9e074ab3d132f4d2a14a46ee9e26d4feff00/eyJfcmFpbHMiOnsibWVzc2FnZSI6IkJBaDdCem9MWm05eWJXRjBTU0lJY0c1bkJqb0dSVlE2RTNKbGMybDZaVjkwYjE5bWFXeHNXd2RwQXBBQmFRS1FBUT09IiwiZXhwIjpudWxsLCJwdXIiOiJ2YXJpYXRpb24ifX0=--8786188a9503cffd21c59bbcd5519930c73c621f/orthpaedic.png)
In Proceedings of 3D NordOst Workshop,
2012
2011
In Proceedings of ICASSP,
2011
In Proceedings of PCG Workshop,
2011

In Proceedings of Vision, Modeling, and Visualization,
2011