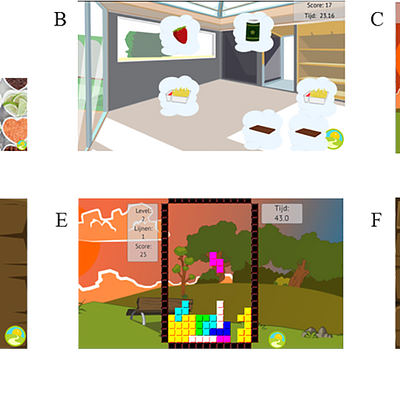
2018
In Proceedings of GALA,
2018
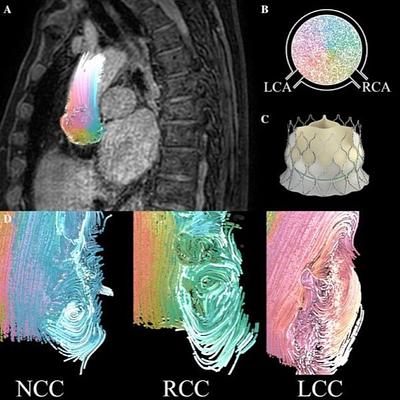
Int J Cardiovasc Imaging,
2018
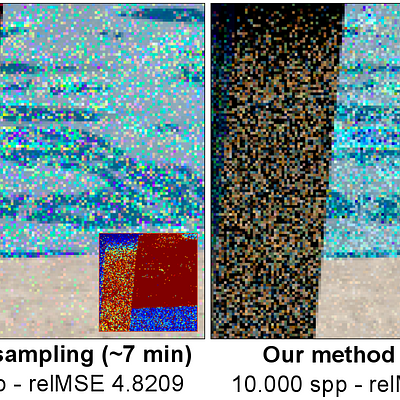
Computer Graphics Forum,
2018
Computer Graphics Forum,
2018
IEEE Transactions on Visualization and Computer Graphics,
2018
Computer Graphics Forum,
2018
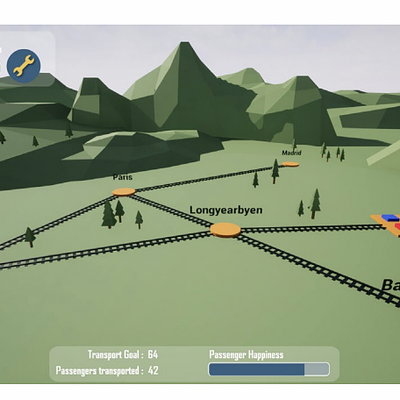
In Proceedings of Superhuman Sports Design Challenge,
2018
ACM Transactions on Graphics,
2018
Computer Graphics Forum,
2018

In Proceedings of Graphics Interface,
2018