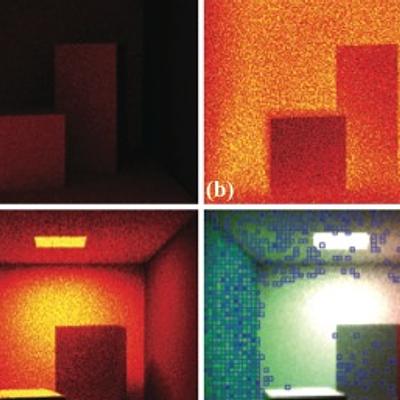
2017

 Comparison (normal map) of our approach with the two state-of-the-art near-light PS algorithms from Ahmad et al. [4] and Mecca et al. [32] for the MONKEY scene. Please note that shadows and discontinuities in our input makes the data already unsuitable for these algorithms, hence it is obvious that their reconstructions fail for most parts.
Jingtang Liao, Bert Buchholz, Jean-Marc Thiery, Pablo Bauszat, and Elmar Eisemann
IEEE Trans Image Process, 2017
: Three dODF-based glyphs for (a) an ensemble with gradually varying shape and orientation and two ensembles of linear tensors with crossing angle of (b) 60 ° and (c) 45 °, respectively. The variation threshold is set to 60% of the maximum variation. The ensembles are illustrated by the small black icons on top.
Changgong Zhang, Matthan Caan, Thomas Höllt, Elmar Eisemann, and Anna Vilanova
Computer Graphics Forum, 2017
The PelVis prototype application featuring the 3D model on the left and a linked MRI and unfolded view visualization on the right
Noeska Natasja Smit, Kai Lawonn, Anne C. Kraima, Marco C. Deruiter, Hessam Sokooti, et al.
IEEE Transactions on Visualization and Computer Graphics, 2017
Retinal photoreceptor distribution. Image adapted from Goldstein
Martin Weier, Michael Stengel, Thorsten Roth, Piotr Didyk, Elmar Eisemann, et al.
Computer Graphics Forum, 2017
Fur design on the bunny mesh. Left: constraints and resulting tangential vector field spline, right: output field visualized as fur on the bunny
Christopher Brandt, Leonardo Scandolo, Elmar Eisemann, and Klaus Hildebrandt
Computer Graphics Forum, 2017
Split-depth frames over time generated by our approach. Via an occlusion cue, split-depth images can induce a 3D effect
Jingtang Liao, Martin Eisemann, and Elmar Eisemann
Computer Graphics Forum, 2017
: (Top) Virtual environment set-up for static scenario as seen by participants. (Bottom) Insets of exemplary stimulus on the 3rd right sphere, shown for white (left) and black (right) interpolation (effect exaggerated for depiction).
Steve Grogorick, Michael Stengel, Elmar Eisemann, and Marcus Magnor
In Proceedings of SAP, 2017
Cloud reflection for a flood in the city of Rotterdam due to a hypothetical scenario of heavy rainfall (100 mm/h)
Johannes G. Leskens, Christian Kehl, Tim Tutenel, Timothy R. Kol, Gerwin de Haan, et al.
Mitig Adapt Strateg Glob Chang, 2017
Analysis of the CD4+ T-cell compartment in inflammatory intestinal diseases. a Third HSNE level embedding of the CD4+ T cells (1.4 × 10⁶ cells, selected in Fig. 3). Color and size of landmarks as described in Fig. 3. Right panel shows density features for the level 3 embedding. Blue encirclement indicates selection of landmarks representing CD28−CD4+ T cells. b Embedding of the CD28−CD4+ T cells (2.6 × 10⁴ cells) at single-cell resolution. Bottom-left panel shows yellow and black dashed encirclements based on CD56− and CD56+ expression, respectively. Three bottom-right panels show cells colored according to: (left) from subjects with different disease status (CeD, Crohn, EATLII, RCDII, and controls), (middle) sampling status (annotated subset, discarded by ACCENSE and downsampled) and (right) tissue-of-origin (blood and intestine)
Vincent van Unen, Thomas Höllt, Nicola Pezzotti, Na Li, Marcel Reinders, et al.
Nat Commun, 2017
Rodrigo Baravalle, Leonardo Scandolo, Claudio Delrieux, Cristian García Bauza, and Elmar Eisemann
Comput Animat Virtual Worlds, 2017
Occlusion-aware cutaway generation. From left to right: User-drawn curve, selected region (shaded green), cutout revealing interior, final illustration using consecutive cutaways.
Mohamed Radwan, Stefan Ohrhallinger, Elmar Eisemann, and Michael Wimmer
In Proceedings of Graphics Interface, 2017
De testopstelling (merk op de speciale + en – knoppen, groot en klein voor zoomen).
Radan Suba, Mattijs Driel, Martijn Meijers, Peter van Oosterom, and Elmar Eisemann
Geo-Info, 2017

2016

Leonardo Scandolo, Pablo Bauszat, and Elmar Eisemann
Computer Graphics Forum, 2016
Noeska Natasja Smit, Cees-Willem Hofstede, Anne C. Kraima, Daniel Jansma, Marco C. Deruiter, et al.
In Proceedings of Eurographics (Education Papers), 2016
The application of the Tender glyphs to compare two DTI datasets acquired with different b-values.
Changgong Zhang, Thomas Schultz, Kai Lawonn, Elmar Eisemann, and Anna Vilanova
IEEE Transactions on Visualization and Computer Graphics, 2016
Noeska Natasja Smit, Anne C. Kraima, Daniel Jansma, Marco C. Deruiter, Elmar Eisemann, and Anna Vilanova
In Proceedings of EuroVis (Short Papers), 2016
Gerard Simons, Marco Ament, Sebastian Herholz, Carsten Dachsbacher, Martin Eisemann, and Elmar Eisemann
In Proceedings of Vision, Modeling, and Visualization, 2016
Niels de Hoon, A.C. Jalba, Elmar Eisemann, and Anna Vilanova
In Proceedings of Visual Computing in Biology and Medicine, 2016
The proposed OPCPs (red), applied to the Venus dataset [2]: (a) Visual enhancement of small patterns between the first two dimensions of the data, i.e., small structures obstructed by a strong pattern. - (b) Facilitated identification of distinct patterns between the second and third data dimension. - (c) Improved readability of outliers, i.e., low density information areas, in the representation. - (d) Efficient and accurate selection (blue) of a specific data structure, using the proposed O-Brushing (dark blue line).
Renata Georgia Raidou, Martin Eisemann, Marcel Breeuwer, Elmar Eisemann, and Anna Vilanova
IEEE Transactions on Visualization and Computer Graphics, 2016